 Kuiper Studio
Why restaurants fail: food cost, selling price and the break even point
This is the least glamorous part of the trade, and the one that decides everything. Until you know what a dish really costs, labour and energy included, you are not setting a price, you are placing a bet. Here is the method, with a full calculation on one ice cream cup.
We measured the location, then built the offer and the message. What remains is the part almost nobody enjoys, and the one that separates restaurants that hold on from restaurants that close: knowing, per item, what the thing you sell actually costs.
Ten cents is vital. But not just any ten cents
I often say that ten cents are vital in a restaurant. People answer that it is hardly a fortune. It is a fortune, but only once you know which line those ten cents sit on. That is exactly why you calculate instead of estimating.
Take two real decisions, and do the arithmetic rather than feeling your way through it. The figures below are a worked example, not a market price list: what matters is the method, and you will substitute your own values.
Case 1: milk at €0.80 from supplier A, or €0.92 from supplier B
Twelve cents a litre sounds alarming. Now bring it back to the unit you sell. If one batch of mix uses 3 litres of milk and yields 45 cups, the extra cost is €0.36 per batch, which is under one cent per cup. Across 2,220 cups a month, the more expensive supplier costs you about €18 more.
Eighteen euros a month for a better product is an easy decision, provided the product really is better. That takes a blind test, not a conviction. Prepare both versions, do not say which is which, and have people from your target clientele taste them. If children cannot tell them apart, take the cheaper one and sleep well.
Case 2: a container that costs €0.10 more
Same apparent amount, radically different consequence. The container is bought per unit sold: ten cents more means ten cents per cup. Across 2,220 cups a month that is €222 a month, close to €2,700 a year. Put differently: you need to sell about seven more cups a day, every day, to get back to the same result.
The rule to keep
Ten cents on an ingredient diluted into a batch is almost nothing. Ten cents on a consumable bought with every single sale is a line on your profit and loss. Before deciding, always bring the gap back to the unit sold, then to the month, then to the number of extra sales required.
The recipe card: the addition, then what everyone forgets
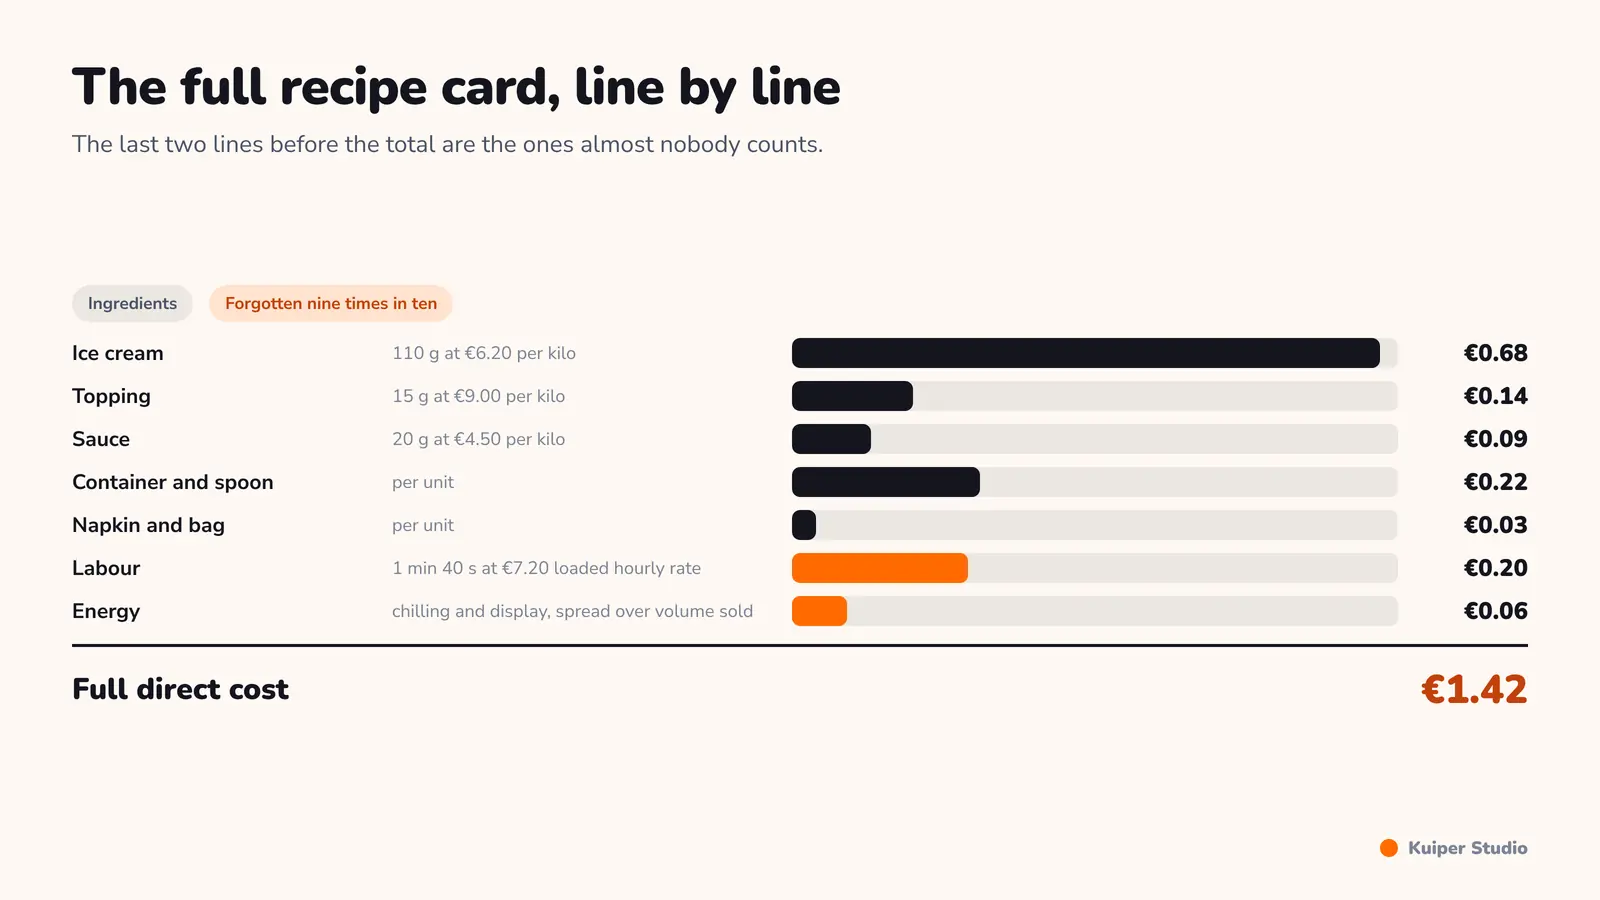
Nine times out of ten a recipe card is an addition: this ingredient, plus this one, plus this one. That is correct, and it is incomplete. Two items are missing that almost nobody counts, and they often weigh more than the gap between two suppliers.
- Labour: how many handling steps to produce one unit, how long they take, and at what fully loaded hourly rate.
- Energy: a freezer, a chilled display or a fryer draws power whether you sell or not, and that draw spreads across the volume actually sold.
Counting labour time often reshuffles the ranking of dishes. A dish with low ingredient cost that needs four minutes of plating can be less profitable than a dish twice as expensive in ingredients and served in thirty seconds.
Full cost of one ice cream cup, worked example
| Line | Detail | Cost |
|---|---|---|
| Ice cream | 110 g at €6.20 per kilo | €0.68 |
| Topping | 15 g at €9.00 per kilo | €0.14 |
| Sauce | 20 g at €4.50 per kilo | €0.09 |
| Container and spoon | per unit | €0.22 |
| Napkin and bag | per unit | €0.03 |
| Ingredients subtotal | €1.16 | |
| Labour | 1 min 40 s at €7.20 loaded hourly rate | €0.20 |
| Energy | chilling and display, spread over volume sold | €0.06 |
| Full direct cost | €1.42 |
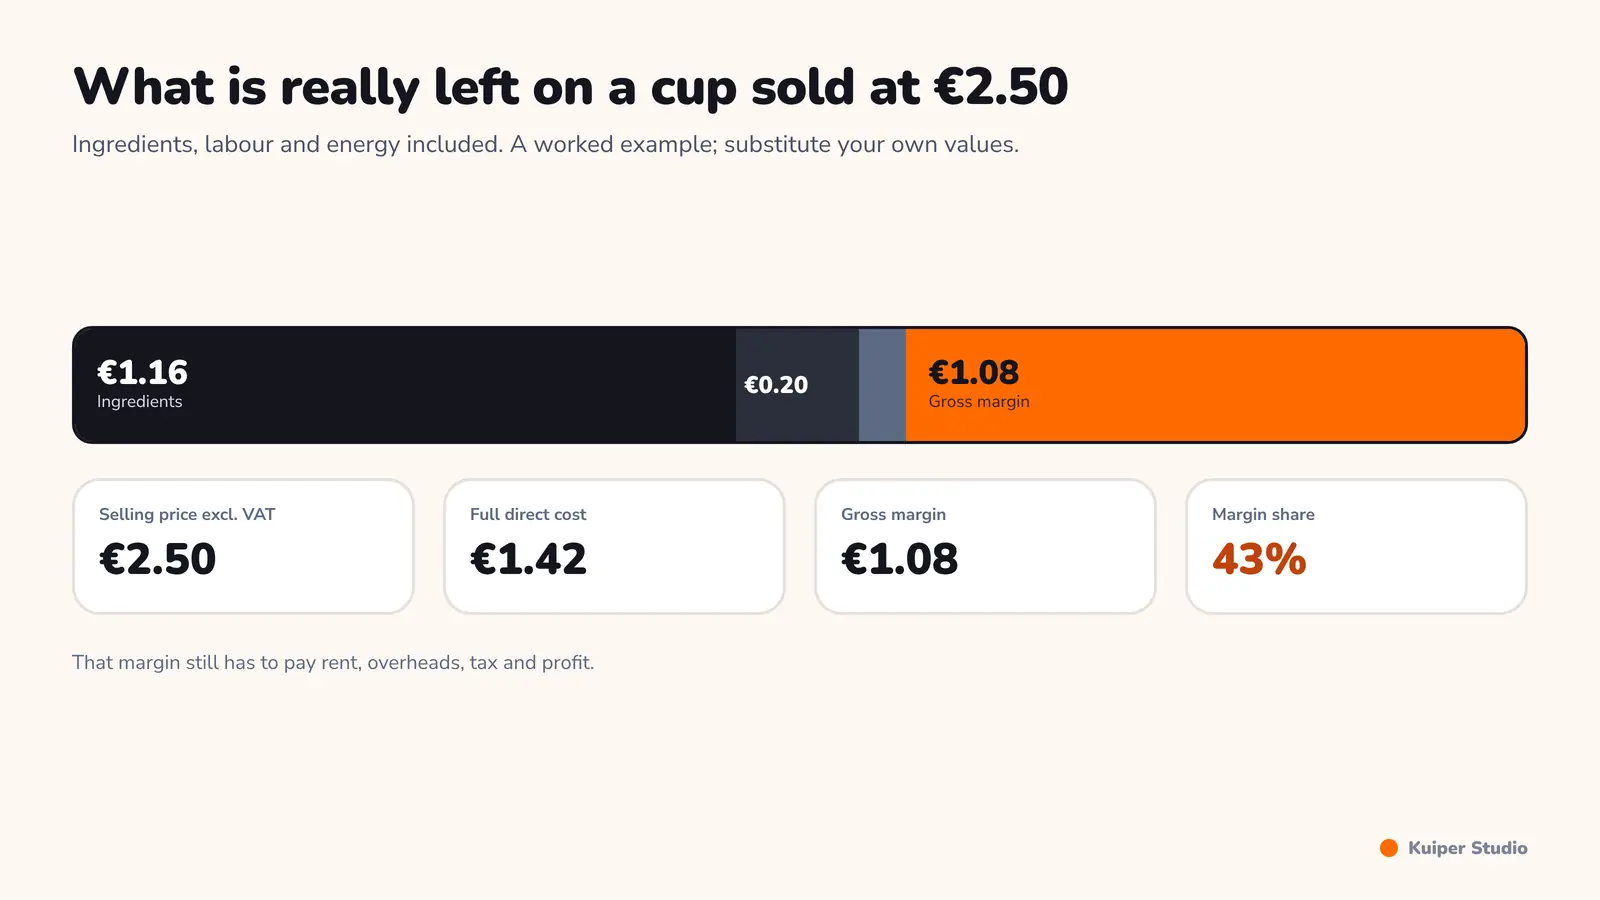
On a cup sold at €2.50 excluding VAT, €1.08 is left to cover rent, overheads, tax and profit.
From cost to break even, in one division
Margin over direct cost is what remains to pay for everything else. At €2.50 excluding VAT per cup, it is €1.08. Now add up your monthly fixed costs: rent, insurance, subscriptions, fixed salaries, accounting, software licences. Say €2,400 a month.
The calculation is one division: 2,400 divided by 1.08 gives 2,223 cups a month to break even, about 74 a day over thirty trading days. That number is the only one that counts. It is the number you hold up against the traffic count from the first article in this series.
74 sales a day
the break even point for a cup sold at €2.50 excluding VAT, with €1.42 of direct cost and €2,400 of monthly fixed costs
If your count gives a hundred passers by a day, the business is not viable at that price: you would have to convert three quarters of them. If the count gives two thousand, you need to convert under four percent, which is reachable. That is the exact moment when the flow measured outside the door becomes a financial decision.
Price is not decided at a desk
Many operators set their price by taking the cost and applying a multiplier. That is a good starting point and a bad final decision. The acceptable price is external data: it belongs to the neighbourhood, not to your spreadsheet.
Go and find it. Have the question asked in the street, by a research firm if you can afford one, by friends if you cannot, but to strangers and in numbers. What would you pay for this? Do you find that price high? Ask several hundred people over several weeks, at different hours, otherwise you are measuring a moment rather than a market.
Suppose the street answers €2.50 when you had planned €2.80. Thirty cents, people say, is nothing. Redo the division: at €2.80 the margin is €1.38 and break even falls to 58 sales a day. At €2.50 it climbs back to 74. Those thirty cents cost you sixteen sales a day, every day.
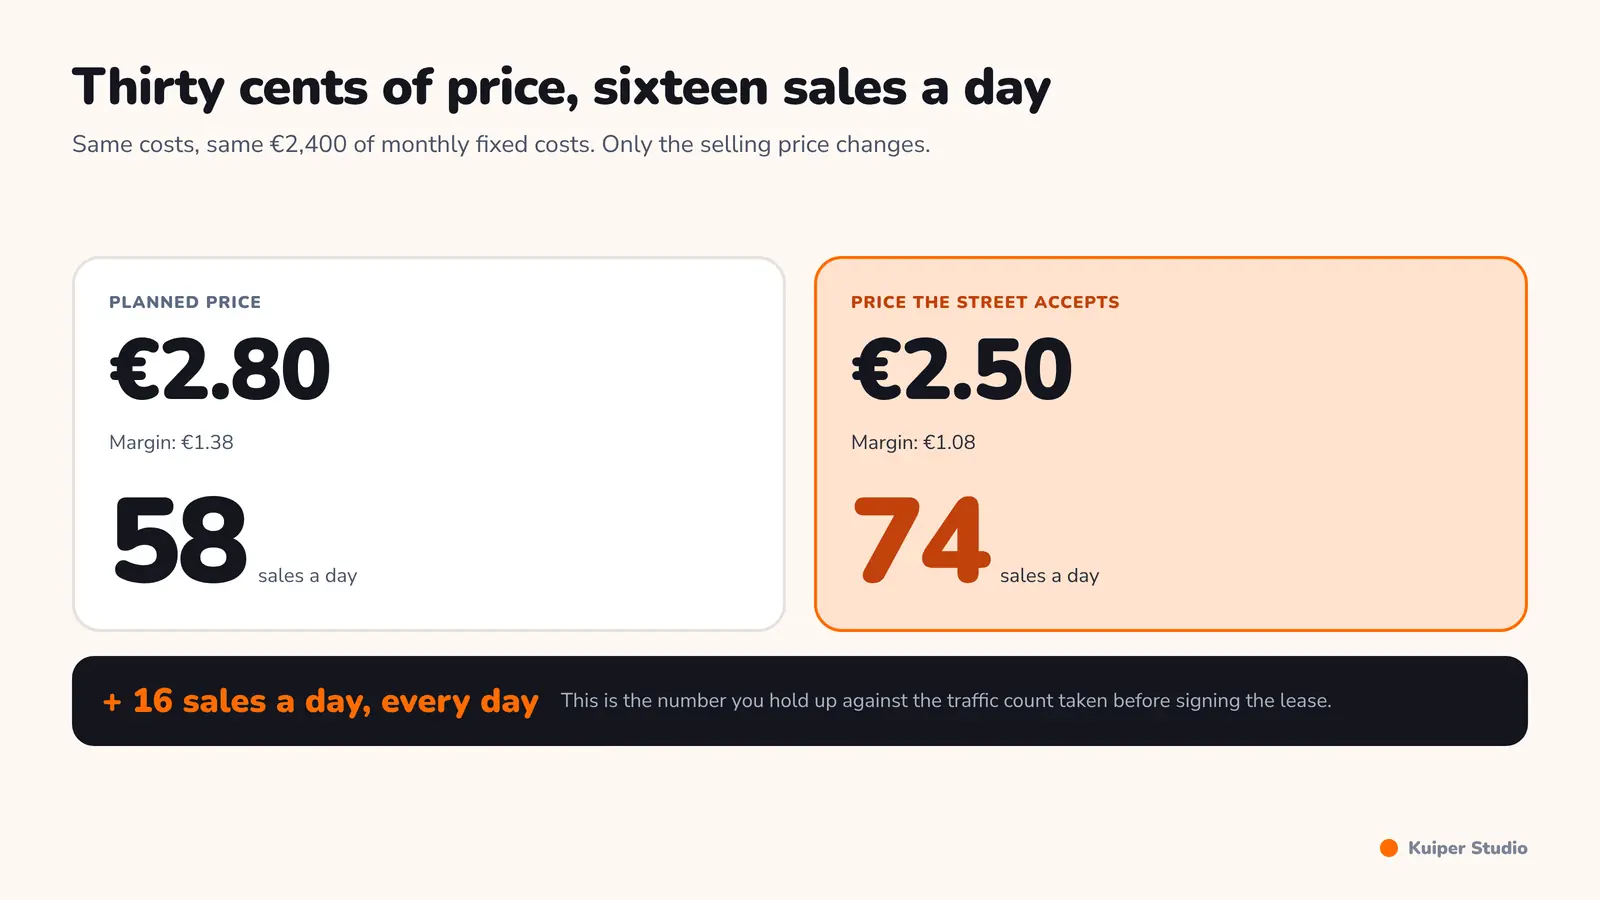
Thirty cents of selling price moves break even by sixteen sales a day. That is why you ask the street before printing the menu.
- Reduce the portion served, if the guest does not perceive it as a loss.
- Cut direct cost, starting with consumables paid on every sale.
- Raise the average ticket with a high margin customisation layer.
- Accept the market price and revisit the level of fixed costs, rent included.
Capex, opex and the rest of the year
Two families of spending never to be mixed. The upfront investment, or capex: machines, furniture, fit out, signage, opening stock. And operating spend, or opex: everything that returns each month, rent, wages, energy, ingredients, insurance, software.
The break even calculated above only covers opex. To know how long it takes to pay back capex, divide the investment by the monthly margin actually earned beyond break even. A project that balances monthly but never repays its investment is not a viable business, it is a badly paid job.
- List your suppliers and their real prices, discounts deducted, per purchase unit.
- Write one recipe card per item, ingredients, labour and energy included.
- Derive the margin over direct cost for each item sold.
- Add up monthly fixed costs, without leaving a single one out.
- Divide to get break even as a number of sales per day.
- Hold that number against the traffic count taken before signing the lease.
- Go and find the acceptable price in the street, and redo the maths with it.
Rank dishes by margin, not by preference
Once recipe cards exist, ranking dishes stops being a matter of opinion. The reference method dates from 1982: Michael Kasavana and Donald Smith proposed crossing two axes only, margin over direct cost and popularity, and placing every item in one of the four resulting quadrants.
The four cases, and what to do with them
| Popularity | Margin | Usual decision |
|---|---|---|
| High | High | Feature it, protect the quality, change nothing |
| High | Low | Test a price rise or cut the direct cost |
| Low | High | Rename, reposition on the menu, offer a taste |
| Low | Low | Remove it, unless it plays a deliberate image role |
This grid does not tell you what to cook. It tells you what to feature, what to rework and what to drop, using figures you have already calculated. It is exactly the work most establishments never do, for lack of up to date recipe cards.
What can be automated in all this
Everything above can be done in a spreadsheet, and many operators rightly start there. The spreadsheet breaks the day supplier prices move, someone changes a recipe without saying so, and nobody knows which version is authoritative.
That is where we come in at Kuiper Studio: link real purchase prices to recipe cards, recalculate margins automatically whenever a tariff changes, and surface on one screen the items whose margin has dropped below the threshold. The calculation stays yours; what we remove is the time spent redoing it by hand.
Never think your cooking will make the difference. What makes the difference is your management. The food will bring guests back; it will not bring them in, and it will not pay your rent.
Frequently asked questions
How do you calculate the food cost of a dish in a restaurant?
Add the ingredient cost of the portion actually served, then add two lines people usually forget: the labour time required to prepare it, valued at the fully loaded hourly rate, and the share of energy used by the equipment, spread over the volume sold. The total is the full direct cost, and margin is calculated from it.
How do you calculate a restaurant's break even point?
Divide total monthly fixed costs by the margin over direct cost of an average sale. The result is the number of sales needed each month to break even; divided by the number of trading days, it gives a daily target you can compare directly against the traffic measured outside your door.
Should you always choose the cheapest supplier?
No. Bring the gap back to the unit sold before deciding. Twelve cents a litre on an ingredient diluted into a batch can be under one cent per sale, so the decision carries no real stake. Ten cents on a consumable bought with every sale, by contrast, is several hundred euros a month.
How do you decide what price to sell a dish for?
Cost gives you a floor price, never the final price. The acceptable price is measured with the target clientele, by asking several hundred people over several weeks and at different hours. Then redo the break even calculation with that price, because thirty cents of difference often moves the daily target by more than twenty percent.
Sources
-
Michael L. Kasavana and Donald I. Smith, Hospitality Publications, Okemos, Michigan, Menu Engineering: A Practical Guide to Menu Analysis (library catalogue record, East Carolina University), 1982.
-
H. G. Parsa, John T. Self, David Njite, Tiffany King, Why Restaurants Fail, Cornell Hotel and Restaurant Administration Quarterly, vol. 46, no. 3, pp. 304-322, August 2005.
What are we building together?
Tell us where it hurts. We answer with a price and a lead time.